Plotting Frequency Spectrum using Matlab
This post shows a variety of ways of how to plot the magnitude frequency content of a discrete signal using matlab.
Contents
- Load Example Data
- Quick view of double-sided (two-sided) magnitude spectrum
- Double-sided magnitude spectrum with frequency axis (in bins)
- Single-sided magnitude spectrum with frequency axis in bins
- Single-sided magnitude spectrum with frequency axis in Hertz
- Single-sided magnitude spectrum with frequency axis normalised
- Single-sided magnitude spectrum – frequency in rads per sample
- Double-sided magnitude spectrum showing negative frequencies
- Single-sided magnitiude spectrum in decibels and Hertz
- Single-sided power spectrum in decibels and Hertz
- Single-sided power spectrum in dB and frequency on a log scale
Load Example Data
% download data from https://www.dropbox.com/s/n4kpd4pp2u3v9nf/tremor_analysis.txt
signal = load('tremor_analysis.txt');
N = length(signal);
fs = 62.5; % 62.5 samples per second
fnyquist = fs/2; %Nyquist frequency
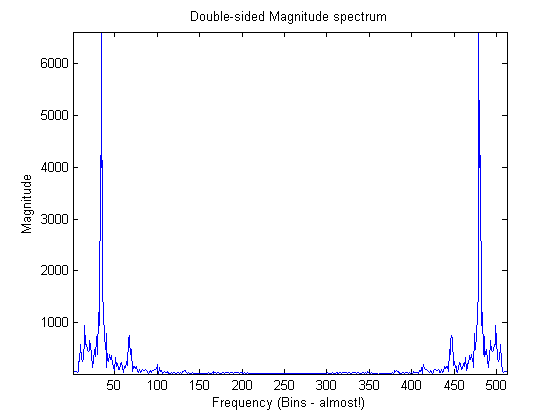
Quick view of double-sided (two-sided) magnitude spectrum
When roughly interpreting this data half way along x-axis corresponds to half the sampling frequency
plot(abs(fft(signal)))
xlabel('Frequency (Bins - almost!)')
ylabel('Magnitude');
title('Double-sided Magnitude spectrum');
axis tight
Double-sided magnitude spectrum with frequency axis (in bins)
fax_bins = [0 : N-1]; %N is the number of samples in the signal
plot(fax_bins, abs(fft(signal)))
xlabel('Frequency (Bins)')
ylabel('Magnitude');
title('Double-sided Magnitude spectrum (bins)');
axis tight

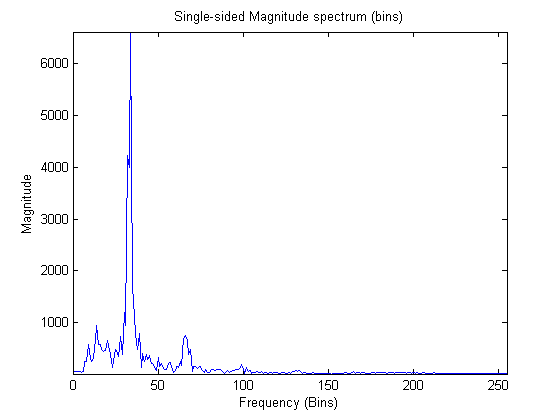
Single-sided magnitude spectrum with frequency axis in bins
X_mags = abs(fft(signal));
fax_bins = [0 : N-1]; %frequency axis in bins
N_2 = ceil(N/2);
plot(fax_bins(1:N_2), X_mags(1:N_2))
xlabel('Frequency (Bins)')
ylabel('Magnitude');
title('Single-sided Magnitude spectrum (bins)');
axis tight
Single-sided magnitude spectrum with frequency axis in Hertz
Each bin frequency is separated by fs/N Hertz.
X_mags = abs(fft(signal));
bin_vals = [0 : N-1];
fax_Hz = bin_vals*fs/N;
N_2 = ceil(N/2);
plot(fax_Hz(1:N_2), X_mags(1:N_2))
xlabel('Frequency (Hz)')
ylabel('Magnitude');
title('Single-sided Magnitude spectrum (Hertz)');
axis tight

Single-sided magnitude spectrum with frequency axis normalised
Normalised to Nyquist frequency. Very common to use this method of normalisation in matlab
X_mags = abs(fft(signal));
bin_vals = [0 : N-1];
fax_norm = (bin_vals*fs/N)/fnyquist; % same as bin_vals/(N/2)
N_2 = ceil(N/2);
plot(fax_norm(1:N_2), X_mags(1:N_2))
xlabel({'Frequency (Normalised to Nyquist Frequency. ' ...
    '1=Nyquist frequency)'})
ylabel('Magnitude');
title('Single-sided Magnitude spectrum (Normalised to Nyquist)');
axis tight

Single-sided magnitude spectrum – frequency in rads per sample
X_mags = abs(fft(signal));
bin_vals = [0 : N-1];
fax_rads_sample = (bin_vals/N)*2*pi;
N_2 = ceil(N/2);
plot(fax_rads_sample(1:N_2), X_mags(1:N_2))
xlabel('Frequency (radians per sample)')
ylabel('Magnitude');
title('Single-sided Magnitude spectrum (rads/sample)');
axis tight

Double-sided magnitude spectrum showing negative frequencies
See http://youtu.be/M1bLPZdNCRA for an explanation of negative frequencies
X_mags = abs(fftshift(fft(signal)));
bin_vals = [0 : N-1];
N_2 = ceil(N/2);
fax_Hz = (bin_vals-N_2)*fs/N;
plot(fax_Hz, X_mags)
xlabel('Frequency (Hz)')
ylabel('Magnitude');
title('Double-sided Magnitude spectrum (Hertz)');
axis tight

Single-sided magnitiude spectrum in decibels and Hertz
X_mags = abs(fft(signal));
bin_vals = [0 : N-1];
fax_Hz = bin_vals*fs/N;
N_2 = ceil(N/2);
plot(fax_Hz(1:N_2), 10*log10(X_mags(1:N_2)))
xlabel('Frequency (Hz)')
ylabel('Magnitude (dB)');
title('Single-sided Magnitude spectrum (Hertz)');
axis tight

Single-sided power spectrum in decibels and Hertz
X_mags = abs(fft(signal));
bin_vals = [0 : N-1];
fax_Hz = bin_vals*fs/N;
N_2 = ceil(N/2);
plot(fax_Hz(1:N_2), 20*log10(X_mags(1:N_2)))
xlabel('Frequency (Hz)')
ylabel('Power (dB)');
title('Single-sided Power spectrum (Hertz)');
axis tight

Single-sided power spectrum in dB and frequency on a log scale
X_mags = abs(fft(signal));
bin_vals = [0 : N-1];
fax_Hz = bin_vals*fs/N;
N_2 = ceil(N/2);
semilogx(fax_Hz(1:N_2), 20*log10(X_mags(1:N_2)))
xlabel('Frequency (Hz)')
ylabel('Power (dB)');
title({'Single-sided Power spectrum' ...
    ' (Frequency in shown on a log scale)'});
axis tight

Categories: matlab code, Uncategorized, youtube demo code

What is bin? it is another unit?
It is an index into the array of the values returned by the Discrete Fourier Transform.
When you take the DFT of a time domain signal x[n] you get a set/array of values X[k] after applying the transform. The value k represents the bin number in the same way the the value n represents the sample number associated with the time-domain signal x[n]. The sample number n can also be thought of as index into the array of values the make up the signal x[n].
The bin number can be converted into frequency in Hz by the expression f = k/N*fs where N is the length of the time-domain signal being analysed by the DFT and fs is the sampleing frequency use to capture x[n]. This is similar to the way that a sample number n can be converted into time by the expression t = n/fs
What is bin? it is another unit?.
Your “Single-sided magnitiude spectrum in decibels and Hertz” should multiply by 20 for dB conversion, no? And the power spectrum should multiply by 10?
http://www.mathworks.com/help/signal/ref/mag2db.html
The gain in power expressed in dB would be 10log10(P/Pref), where P is the power measured and Pref is some reference power level. If the reference power level is 1 watt then gain would be 10log10(P).
Digital signals captured from an Analog to Digital Converter are usually voltage signals. So the sequence of numbers in a digital signal are related to voltage rather than power.
Power = V^2/R, where V is voltage across a resistance of R ohms. If, for convenience, we set R to 1 then Power = V^2 (the value of R doesn’t really matter since we are only interest in relative changes in power, and we usually have no idea how the numbers in the digital signal relate to voltage in the first place! A value of 1 could equate to 3, 5, or 10 volts, or any other value!).
So if you have a voltage signal and would like to determine the power in dB you can substitute V^2 for P in the equation above giving 10log10(V^2) = 20log10(V)
Thanks for your explanation! Fabulous!
Congratulations for your post!!! It is very elucidative!!!
I would like to thank you for making the youtube video and this blog, super clear and helpful! Many thanks!!
this is the best shit, come back every time i forget how to run a power spectrum